class: title-slide, center, bottom <img src="images/lter_penguins.png" width="400" /> # An Antarctic Tour of the Tidyverse ## R-Ladies Chicago ### Silvia Canelón, PhD ### August 31, 2020 --- class: about-me, middle, center ## Silvia Canelón ### Postdoctoral Research Scientist ### University of Pennsylvania, Philadelphia, PA, USA <img style="border-radius: 50%;" src="https://silvia.rbind.io/authors/silvia/avatar_hu5008cfaae4fe27558f3c3604a254cbf4_10721386_270x270_fill_lanczos_center_2.png" width="150px"/> [<i class="fas fa-link "></i> silvia.rbind.io](https://silvia.rbind.io)<br/> [<i class="fab fa-twitter "></i> @spcanelon](https://twitter.com/spcanelon)<br/> [<i class="fab fa-github "></i> @spcanelon](https://github.com/spcanelon) .footnote[<span>Photo by <a href="https://unsplash.com/@lukehuff?utm_source=unsplash&utm_medium=referral&utm_content=creditCopyText">lucas huffman</a> on <a href="https://unsplash.com/s/photos/antarctica?utm_source=unsplash&utm_medium=referral&utm_content=creditCopyText">Unsplash</a></span>] --- class: left, middle # Acknowledgments ### [palmerpenguins](https://allisonhorst.github.io/palmerpenguins/articles/intro.html) 📦 developed by Drs. [Allison Horst](https://www.allisonhorst.com/), [Alison Hill](https://alison.rbind.io/), and [Kristen Gorman](https://www.uaf.edu/cfos/people/faculty/detail/kristen-gorman.php). ### Penguin artwork by Allison Horst ([@allison_horst](https://twitter.com/allison_horst)) ### Slide inspiration from Alison Hill ([@apreshill](https://twitter.com/apreshill))'s recent education training materials "[Teaching in Production](https://rstudio-education.github.io/teaching-in-production/)" ### Slides made using Dr. Yihui Xie's [xaringan](https://github.com/yihui/xaringan) 📦 and Garrick Aden-Buie's [xaringanExtra](https://github.com/gadenbuie/xaringanExtra) 📦, and adapted from the [R-Ladies `xaringan` theme designed by Alison Hill](https://alison.rbind.io/post/2017-12-18-r-ladies-presentation-ninja/) ### Photographs from various photographers on Unsplash, and noted on the relevant slide --- class: left, top background-image: url(images/logo.png) background-position: 1050px 50px background-size: 80px # Meet our penguin friends! <div class="flex" style="margin: 0 0em;"> <div class="column"> <h3> Chinstrap </h3> <img src="images/penguin_chinstrap.jpg" style="width: 100%;"> </div> <div class="column" style="margin: 0 1em;"> <h3> Gentoo </h3> <img src="images/penguin_gentoo.jpg" style=""> </div> <div class="column" style="margin: 0 0em;"> <h3> Adélie </h3> <img src="images/penguin_adelie.jpg" style=""> </div> </div> .footnote[🐧<span>Photos by <a href="https://unsplash.com/@longmaspirit?utm_source=unsplash&utm_medium=referral&utm_content=creditCopyText">Long Ma</a> on <a href="https://unsplash.com/collections/12240655/palmerpenguins/d5aed8c855e26061e5e651d3f180b76d?utm_source=unsplash&utm_medium=referral&utm_content=creditCopyText">Unsplash</a></span> ] --- class: right, top background-image: url(images/pptx/tidyverse.png) background-size: 1150px ## Collection of R packages, including <br/> these 8 core packages (and more!) --- class: penguin-tour <img src="images/pptx/01-readr.png" width="1200" /> .footnote[<span>Photo by <a href="https://unsplash.com/@eadesstudio?utm_source=unsplash&utm_medium=referral&utm_content=creditCopyText">James Eades</a> on <a href="https://unsplash.com/collections/12240655/palmerpenguins/d5aed8c855e26061e5e651d3f180b76d?utm_source=unsplash&utm_medium=referral&utm_content=creditCopyText">Unsplash</a></span> ] --- background-image: url(images/hex/readr.png) background-position: 1050px 50px background-size: 80px # readr: info .panelset[ .panel[.panel-name[Overview] .pull-left[ ### Importing data is the very first step! <br/> You can use `readr` to import rectangular data. ] .pull-right[ ### You can import... - comma separated (CSV) files with `read_csv()` - tab separated files with `read_tsv()` - general delimited files with `read_delim()` - fixed width files with `read_fwf()` - tabular files where columns are separated by white-space with `read_table()` - web log files with `read_log()` ] ] .panel[.panel-name[Cheatsheet] <i class="fas fa-file-pdf "></i> PDF: https://github.com/rstudio/cheatsheets/raw/master/data-import.pdf  ] .panel[.panel-name[Reading] .left-column[ <img src="images/r4ds-cover.png" width="222" /> ] .right-column[ ### R for Data Science: [Ch 11 Data import](https://r4ds.had.co.nz/data-import.html) ### Package documentation: https://readr.tidyverse.org/ ] ] ] --- background-image: url(images/hex/readr.png) background-position: 1050px 50px background-size: 80px # readr: exercise .panelset[ .panel[.panel-name[Read data in] .center[ ### Both options below will get you the same dataset!] Option 1 ```r # option 1: load using URL ---- raw_adelie_url <- read_csv("https://portal.edirepository.org/nis/dataviewer?packageid=knb-lter-pal.219.3&entityid=002f3893385f710df69eeebe893144ff") ``` Option 2 ```r # option 2: load using filepath ---- raw_adelie_filepath <- read_csv("tutorial/raw_adelie.csv") ``` ] .panel[.panel-name[Save data] Lucky for us, the `palmerpenguins` 📦 compiles data from all three species together for us! .pull-left[ `penguins` contains a clean dataset ```r # saves package tibble into global environment penguins <- palmerpenguins::penguins head(penguins) ## # A tibble: 6 x 8 ## species island bill_length_mm bill_depth_mm flipper_length_mm body_mass_g sex year ## <fct> <fct> <dbl> <dbl> <int> <int> <fct> <int> ## 1 Adelie Torgersen 39.1 18.7 181 3750 male 2007 ## 2 Adelie Torgersen 39.5 17.4 186 3800 female 2007 ## 3 Adelie Torgersen 40.3 18 195 3250 female 2007 ## 4 Adelie Torgersen NA NA NA NA <NA> 2007 ## 5 Adelie Torgersen 36.7 19.3 193 3450 female 2007 ## 6 Adelie Torgersen 39.3 20.6 190 3650 male 2007 ``` ] .pull-right[ `penguins_raw` contains raw data ```r penguins_raw <- palmerpenguins::penguins_raw head(penguins_raw) ## # A tibble: 6 x 17 ## studyName `Sample Number` Species Region Island Stage `Individual ID` `Clutch Complet… `Date Egg` `Culmen Length … `Culmen Depth (… `Flipper Length… ## <chr> <dbl> <chr> <chr> <chr> <chr> <chr> <chr> <date> <dbl> <dbl> <dbl> ## 1 PAL0708 1 Adelie… Anvers Torge… Adul… N1A1 Yes 2007-11-11 39.1 18.7 181 ## 2 PAL0708 2 Adelie… Anvers Torge… Adul… N1A2 Yes 2007-11-11 39.5 17.4 186 ## 3 PAL0708 3 Adelie… Anvers Torge… Adul… N2A1 Yes 2007-11-16 40.3 18 195 ## 4 PAL0708 4 Adelie… Anvers Torge… Adul… N2A2 Yes 2007-11-16 NA NA NA ## 5 PAL0708 5 Adelie… Anvers Torge… Adul… N3A1 Yes 2007-11-16 36.7 19.3 193 ## 6 PAL0708 6 Adelie… Anvers Torge… Adul… N3A2 Yes 2007-11-16 39.3 20.6 190 ## # … with 5 more variables: `Body Mass (g)` <dbl>, Sex <chr>, `Delta 15 N (o/oo)` <dbl>, `Delta 13 C (o/oo)` <dbl>, Comments <chr> ``` ] ] ] --- class: penguin-tour <img src="images/pptx/02-tibble.png" width="1200" /> .footnote[ <span>Photo by <a href="https://unsplash.com/@eadesstudio?utm_source=unsplash&utm_medium=referral&utm_content=creditCopyText">James Eades</a> on <a href="https://unsplash.com/collections/12240655/palmerpenguins/d5aed8c855e26061e5e651d3f180b76d?utm_source=unsplash&utm_medium=referral&utm_content=creditCopyText">Unsplash</a></span> ] --- background-image: url(images/hex/tibble.png) background-position: 1050px 50px background-size: 80px # tibble: info .panelset[ .panel[.panel-name[Overview] .pull-left[ ### A `tibble` is much like the `dataframe` in base R, but optimized for use in the Tidyverse. ] ] .panel[.panel-name[Cheatsheet] <i class="fas fa-file-pdf "></i> PDF (tidyr): https://github.com/rstudio/cheatsheets/raw/master/data-transformation.pdf  ] .panel[.panel-name[Reading] .left-column[ <img src="images/r4ds-cover.png" width="222" /> ] .right-column[ ### R for Data Science: [Ch 10 Tibbles](https://r4ds.had.co.nz/tibbles.html) ### Package documentation: https://tibble.tidyverse.org/ ] ] ] --- background-image: url(images/hex/tibble.png) background-position: 1050px 50px background-size: 80px # tibble: exercise .panelset[ .panel[.panel-name[Code] Let's take a look at the differences! ```r # try each of these commands in the console and see if you can spot the differences! as_tibble(penguins) as.data.frame(penguins) ``` ] .panel[.panel-name[Result] .pull-left[ ```r as_tibble(penguins) ## # A tibble: 344 x 8 ## species island bill_length_mm bill_depth_mm flipper_length_mm body_mass_g sex year ## <fct> <fct> <dbl> <dbl> <int> <int> <fct> <int> ## 1 Adelie Torgersen 39.1 18.7 181 3750 male 2007 ## 2 Adelie Torgersen 39.5 17.4 186 3800 female 2007 ## 3 Adelie Torgersen 40.3 18 195 3250 female 2007 ## 4 Adelie Torgersen NA NA NA NA <NA> 2007 ## 5 Adelie Torgersen 36.7 19.3 193 3450 female 2007 ## 6 Adelie Torgersen 39.3 20.6 190 3650 male 2007 ## 7 Adelie Torgersen 38.9 17.8 181 3625 female 2007 ## 8 Adelie Torgersen 39.2 19.6 195 4675 male 2007 ## 9 Adelie Torgersen 34.1 18.1 193 3475 <NA> 2007 ## 10 Adelie Torgersen 42 20.2 190 4250 <NA> 2007 ## # … with 334 more rows ``` ] .pull-right[ ```r as.data.frame(penguins) ## species island bill_length_mm bill_depth_mm flipper_length_mm body_mass_g sex year ## 1 Adelie Torgersen 39.1 18.7 181 3750 male 2007 ## 2 Adelie Torgersen 39.5 17.4 186 3800 female 2007 ## 3 Adelie Torgersen 40.3 18.0 195 3250 female 2007 ## 4 Adelie Torgersen NA NA NA NA <NA> 2007 ## 5 Adelie Torgersen 36.7 19.3 193 3450 female 2007 ## 6 Adelie Torgersen 39.3 20.6 190 3650 male 2007 ## 7 Adelie Torgersen 38.9 17.8 181 3625 female 2007 ## 8 Adelie Torgersen 39.2 19.6 195 4675 male 2007 ## 9 Adelie Torgersen 34.1 18.1 193 3475 <NA> 2007 ## 10 Adelie Torgersen 42.0 20.2 190 4250 <NA> 2007 ## 11 Adelie Torgersen 37.8 17.1 186 3300 <NA> 2007 ## 12 Adelie Torgersen 37.8 17.3 180 3700 <NA> 2007 ## 13 Adelie Torgersen 41.1 17.6 182 3200 female 2007 ## 14 Adelie Torgersen 38.6 21.2 191 3800 male 2007 ## 15 Adelie Torgersen 34.6 21.1 198 4400 male 2007 ## 16 Adelie Torgersen 36.6 17.8 185 3700 female 2007 ## 17 Adelie Torgersen 38.7 19.0 195 3450 female 2007 ## 18 Adelie Torgersen 42.5 20.7 197 4500 male 2007 ## 19 Adelie Torgersen 34.4 18.4 184 3325 female 2007 ## 20 Adelie Torgersen 46.0 21.5 194 4200 male 2007 ## 21 Adelie Biscoe 37.8 18.3 174 3400 female 2007 ## 22 Adelie Biscoe 37.7 18.7 180 3600 male 2007 ## 23 Adelie Biscoe 35.9 19.2 189 3800 female 2007 ## 24 Adelie Biscoe 38.2 18.1 185 3950 male 2007 ## 25 Adelie Biscoe 38.8 17.2 180 3800 male 2007 ## 26 Adelie Biscoe 35.3 18.9 187 3800 female 2007 ## 27 Adelie Biscoe 40.6 18.6 183 3550 male 2007 ## 28 Adelie Biscoe 40.5 17.9 187 3200 female 2007 ## 29 Adelie Biscoe 37.9 18.6 172 3150 female 2007 ## 30 Adelie Biscoe 40.5 18.9 180 3950 male 2007 ## 31 Adelie Dream 39.5 16.7 178 3250 female 2007 ## 32 Adelie Dream 37.2 18.1 178 3900 male 2007 ## 33 Adelie Dream 39.5 17.8 188 3300 female 2007 ## 34 Adelie Dream 40.9 18.9 184 3900 male 2007 ## 35 Adelie Dream 36.4 17.0 195 3325 female 2007 ## 36 Adelie Dream 39.2 21.1 196 4150 male 2007 ## 37 Adelie Dream 38.8 20.0 190 3950 male 2007 ## 38 Adelie Dream 42.2 18.5 180 3550 female 2007 ## 39 Adelie Dream 37.6 19.3 181 3300 female 2007 ## 40 Adelie Dream 39.8 19.1 184 4650 male 2007 ## 41 Adelie Dream 36.5 18.0 182 3150 female 2007 ## 42 Adelie Dream 40.8 18.4 195 3900 male 2007 ## 43 Adelie Dream 36.0 18.5 186 3100 female 2007 ## 44 Adelie Dream 44.1 19.7 196 4400 male 2007 ## 45 Adelie Dream 37.0 16.9 185 3000 female 2007 ## 46 Adelie Dream 39.6 18.8 190 4600 male 2007 ## 47 Adelie Dream 41.1 19.0 182 3425 male 2007 ## 48 Adelie Dream 37.5 18.9 179 2975 <NA> 2007 ## 49 Adelie Dream 36.0 17.9 190 3450 female 2007 ## 50 Adelie Dream 42.3 21.2 191 4150 male 2007 ## 51 Adelie Biscoe 39.6 17.7 186 3500 female 2008 ## 52 Adelie Biscoe 40.1 18.9 188 4300 male 2008 ## 53 Adelie Biscoe 35.0 17.9 190 3450 female 2008 ## 54 Adelie Biscoe 42.0 19.5 200 4050 male 2008 ## 55 Adelie Biscoe 34.5 18.1 187 2900 female 2008 ## 56 Adelie Biscoe 41.4 18.6 191 3700 male 2008 ## 57 Adelie Biscoe 39.0 17.5 186 3550 female 2008 ## 58 Adelie Biscoe 40.6 18.8 193 3800 male 2008 ## 59 Adelie Biscoe 36.5 16.6 181 2850 female 2008 ## 60 Adelie Biscoe 37.6 19.1 194 3750 male 2008 ## 61 Adelie Biscoe 35.7 16.9 185 3150 female 2008 ## 62 Adelie Biscoe 41.3 21.1 195 4400 male 2008 ## 63 Adelie Biscoe 37.6 17.0 185 3600 female 2008 ## 64 Adelie Biscoe 41.1 18.2 192 4050 male 2008 ## 65 Adelie Biscoe 36.4 17.1 184 2850 female 2008 ## 66 Adelie Biscoe 41.6 18.0 192 3950 male 2008 ## 67 Adelie Biscoe 35.5 16.2 195 3350 female 2008 ## 68 Adelie Biscoe 41.1 19.1 188 4100 male 2008 ## 69 Adelie Torgersen 35.9 16.6 190 3050 female 2008 ## 70 Adelie Torgersen 41.8 19.4 198 4450 male 2008 ## 71 Adelie Torgersen 33.5 19.0 190 3600 female 2008 ## 72 Adelie Torgersen 39.7 18.4 190 3900 male 2008 ## 73 Adelie Torgersen 39.6 17.2 196 3550 female 2008 ## 74 Adelie Torgersen 45.8 18.9 197 4150 male 2008 ## 75 Adelie Torgersen 35.5 17.5 190 3700 female 2008 ## 76 Adelie Torgersen 42.8 18.5 195 4250 male 2008 ## 77 Adelie Torgersen 40.9 16.8 191 3700 female 2008 ## 78 Adelie Torgersen 37.2 19.4 184 3900 male 2008 ## 79 Adelie Torgersen 36.2 16.1 187 3550 female 2008 ## 80 Adelie Torgersen 42.1 19.1 195 4000 male 2008 ## 81 Adelie Torgersen 34.6 17.2 189 3200 female 2008 ## 82 Adelie Torgersen 42.9 17.6 196 4700 male 2008 ## 83 Adelie Torgersen 36.7 18.8 187 3800 female 2008 ## 84 Adelie Torgersen 35.1 19.4 193 4200 male 2008 ## 85 Adelie Dream 37.3 17.8 191 3350 female 2008 ## 86 Adelie Dream 41.3 20.3 194 3550 male 2008 ## 87 Adelie Dream 36.3 19.5 190 3800 male 2008 ## 88 Adelie Dream 36.9 18.6 189 3500 female 2008 ## 89 Adelie Dream 38.3 19.2 189 3950 male 2008 ## 90 Adelie Dream 38.9 18.8 190 3600 female 2008 ## 91 Adelie Dream 35.7 18.0 202 3550 female 2008 ## 92 Adelie Dream 41.1 18.1 205 4300 male 2008 ## 93 Adelie Dream 34.0 17.1 185 3400 female 2008 ## 94 Adelie Dream 39.6 18.1 186 4450 male 2008 ## 95 Adelie Dream 36.2 17.3 187 3300 female 2008 ## 96 Adelie Dream 40.8 18.9 208 4300 male 2008 ## 97 Adelie Dream 38.1 18.6 190 3700 female 2008 ## 98 Adelie Dream 40.3 18.5 196 4350 male 2008 ## 99 Adelie Dream 33.1 16.1 178 2900 female 2008 ## 100 Adelie Dream 43.2 18.5 192 4100 male 2008 ## 101 Adelie Biscoe 35.0 17.9 192 3725 female 2009 ## 102 Adelie Biscoe 41.0 20.0 203 4725 male 2009 ## 103 Adelie Biscoe 37.7 16.0 183 3075 female 2009 ## 104 Adelie Biscoe 37.8 20.0 190 4250 male 2009 ## 105 Adelie Biscoe 37.9 18.6 193 2925 female 2009 ## 106 Adelie Biscoe 39.7 18.9 184 3550 male 2009 ## 107 Adelie Biscoe 38.6 17.2 199 3750 female 2009 ## 108 Adelie Biscoe 38.2 20.0 190 3900 male 2009 ## 109 Adelie Biscoe 38.1 17.0 181 3175 female 2009 ## 110 Adelie Biscoe 43.2 19.0 197 4775 male 2009 ## 111 Adelie Biscoe 38.1 16.5 198 3825 female 2009 ## 112 Adelie Biscoe 45.6 20.3 191 4600 male 2009 ## 113 Adelie Biscoe 39.7 17.7 193 3200 female 2009 ## 114 Adelie Biscoe 42.2 19.5 197 4275 male 2009 ## 115 Adelie Biscoe 39.6 20.7 191 3900 female 2009 ## 116 Adelie Biscoe 42.7 18.3 196 4075 male 2009 ## 117 Adelie Torgersen 38.6 17.0 188 2900 female 2009 ## 118 Adelie Torgersen 37.3 20.5 199 3775 male 2009 ## 119 Adelie Torgersen 35.7 17.0 189 3350 female 2009 ## 120 Adelie Torgersen 41.1 18.6 189 3325 male 2009 ## 121 Adelie Torgersen 36.2 17.2 187 3150 female 2009 ## 122 Adelie Torgersen 37.7 19.8 198 3500 male 2009 ## 123 Adelie Torgersen 40.2 17.0 176 3450 female 2009 ## 124 Adelie Torgersen 41.4 18.5 202 3875 male 2009 ## 125 Adelie Torgersen 35.2 15.9 186 3050 female 2009 ## [ reached 'max' / getOption("max.print") -- omitted 219 rows ] ``` ] ] .panel[.panel-name[Chat] ### What differences do you see? You might see a `tibble` prints: - variable classes - only 10 rows - only as many columns as can fit on the screen - `NA`s are highlighted in console so they're easy to spot (font highlighting and styling in `tibble`) Not so much a concern in an R Markdown file, but noticeable in the console. Print method makes it easier to work with large datasets. ] .panel[.panel-name[More] There are a couple of other main differences, namely in **subsetting** and **recycling**. Check them out in the [`vignette("tibble")`](https://tibble.tidyverse.org/articles/tibble.html) Try it out here! ```r vignette("tibble") ``` ] ] --- class: penguin-tour <img src="images/pptx/03-ggplot2.png" width="1200" /> .footnote[<span>Photo by <a href="https://unsplash.com/@eadesstudio?utm_source=unsplash&utm_medium=referral&utm_content=creditCopyText">James Eades</a> on <a href="https://unsplash.com/collections/12240655/palmerpenguins/d5aed8c855e26061e5e651d3f180b76d?utm_source=unsplash&utm_medium=referral&utm_content=creditCopyText">Unsplash</a></span> ] --- background-image: url(images/hex/ggplot2.png) background-position: 1050px 50px background-size: 80px # ggplot2: info .panelset[ .panel[.panel-name[Overview] ### Let's start by making a simple plot of our data! ### `ggplot2` uses the "Grammar of Graphics" and layers graphical components together to create a plot. ] .panel[.panel-name[Cheatsheet] <i class="fas fa-file-pdf "></i> PDF: https://github.com/rstudio/cheatsheets/raw/master/data-visualization-2.1.pdf  ] .panel[.panel-name[Reading] .left-column[ <img src="images/r4ds-cover.png" width="222" /> ] .right-column[ ### R for Data Science: [Ch 3 Data visualization](https://r4ds.had.co.nz/data-visualisation.html) ### Package documentation: https://ggplot2.tidyverse.org/ ] ] ] --- background-image: url(images/hex/ggplot2.png) background-position: 1050px 50px background-size: 80px # ggplot2: exercise .panelset[ .panel[.panel-name[View the data] .pull-left[ ### Get a full view of the dataset: ```r View(penguins) ``` ] .pull-right[ ### Or catch a `glimpse`: ```r glimpse(penguins) ## Rows: 344 ## Columns: 8 ## $ species <fct> Adelie, Adelie, Adelie, Adelie, Adelie, Adelie, Adelie, Adelie, Adelie, Adelie, Adelie, Adelie, Adelie, Adelie, Adelie, Adelie, Adelie… ## $ island <fct> Torgersen, Torgersen, Torgersen, Torgersen, Torgersen, Torgersen, Torgersen, Torgersen, Torgersen, Torgersen, Torgersen, Torgersen, To… ## $ bill_length_mm <dbl> 39.1, 39.5, 40.3, NA, 36.7, 39.3, 38.9, 39.2, 34.1, 42.0, 37.8, 37.8, 41.1, 38.6, 34.6, 36.6, 38.7, 42.5, 34.4, 46.0, 37.8, 37.7, 35.9… ## $ bill_depth_mm <dbl> 18.7, 17.4, 18.0, NA, 19.3, 20.6, 17.8, 19.6, 18.1, 20.2, 17.1, 17.3, 17.6, 21.2, 21.1, 17.8, 19.0, 20.7, 18.4, 21.5, 18.3, 18.7, 19.2… ## $ flipper_length_mm <int> 181, 186, 195, NA, 193, 190, 181, 195, 193, 190, 186, 180, 182, 191, 198, 185, 195, 197, 184, 194, 174, 180, 189, 185, 180, 187, 183, … ## $ body_mass_g <int> 3750, 3800, 3250, NA, 3450, 3650, 3625, 4675, 3475, 4250, 3300, 3700, 3200, 3800, 4400, 3700, 3450, 4500, 3325, 4200, 3400, 3600, 3800… ## $ sex <fct> male, female, female, NA, female, male, female, male, NA, NA, NA, NA, female, male, male, female, female, male, female, male, female, … ## $ year <int> 2007, 2007, 2007, 2007, 2007, 2007, 2007, 2007, 2007, 2007, 2007, 2007, 2007, 2007, 2007, 2007, 2007, 2007, 2007, 2007, 2007, 2007, 20… ``` ] ] .panel[.panel-name[Scatterplot] Let's see if body mass varies by penguin sex .pull-left[ ```r ggplot(data = penguins, * aes(x = sex, y = body_mass_g)) + geom_point() ``` ] .pull-right[ <img src="2020-rladies-chi-tidyverse_files/figure-html/unnamed-chunk-18-1.png" width="504" /> ] ] .panel[.panel-name[Boxplot] .pull-left[ ```r ggplot(data = penguins, aes(x = sex, y = body_mass_g)) + * geom_boxplot() ``` ] .pull-right[ <img src="2020-rladies-chi-tidyverse_files/figure-html/unnamed-chunk-20-1.png" width="504" /> ] ] .panel[.panel-name[By Species] .pull-left[ ```r ggplot(data = penguins, aes(x = sex, y = body_mass_g)) + * geom_boxplot(aes(fill = species)) ``` ### <br/> What do you notice? ] .pull-right[ <img src="2020-rladies-chi-tidyverse_files/figure-html/unnamed-chunk-22-1.png" width="504" /> ] ] .panel[.panel-name[Chat] ### You might see... .pull-left[ - Gentoo penguins have higher body mass than Adélie and Chinstrap penguins - Higher body mass among male Gentoo penguins compared to female penguins - Pattern not as discernible when comparing Adélie and Chinstrap penguins - No *NA*s among Chinstrap penguin data points! **sex** was available for each observation ] .pull-right[ <img src="2020-rladies-chi-tidyverse_files/figure-html/unnamed-chunk-23-1.png" width="504" /> ] ] ] --- class: penguin-tour <img src="images/pptx/04-dplyr.png" width="1200" /> .footnote[<span>Photo by <a href="https://unsplash.com/@eadesstudio?utm_source=unsplash&utm_medium=referral&utm_content=creditCopyText">James Eades</a> on <a href="https://unsplash.com/collections/12240655/palmerpenguins/d5aed8c855e26061e5e651d3f180b76d?utm_source=unsplash&utm_medium=referral&utm_content=creditCopyText">Unsplash</a></span> ] --- background-image: url(images/hex/dplyr.png) background-position: 1050px 50px background-size: 80px # dplyr: info .panelset[ .panel[.panel-name[Overview] .pull-left[ ### Data transformation helps you get the data in exactly the right form you need. <br/> With `dplyr` you can: - create new variables - create summaries - rename variables - reorder observations - ...and more! ] .pull-right[ - Pick observations by their values with `filter()`. - Reorder the rows with `arrange()`. - Pick variables by their names `select()`. - Create new variables with functions of existing variables with `mutate()`. - Collapse many values down to a single summary with `summarize()`. - `group_by()` gets the above functions to operate group-by-group rather than on the entire dataset. - and `count()` + `add_count()` simplify `group_by()` + `summarize()` when you just want to count ] ] .panel[.panel-name[Cheatsheet] <i class="fas fa-file-pdf "></i> PDF: https://github.com/rstudio/cheatsheets/raw/master/data-transformation.pdf  ] .panel[.panel-name[Reading] .left-column[ <img src="images/r4ds-cover.png" width="222" /> ] .right-column[ ### R for Data Science: [Ch 11 Data transformation](https://r4ds.had.co.nz/transform.html) ### Package documentation: https://dplyr.tidyverse.org/ ] ] ] --- background-image: url(images/hex/dplyr.png) background-position: 1050px 50px background-size: 80px # dplyr: exercise .panelset[ .panel[.panel-name[Select] .center[ ### Can you spot the difference in performing the same operation? ] .pull-left[ ```r select(penguins, species, sex, body_mass_g) ## # A tibble: 344 x 3 ## species sex body_mass_g ## <fct> <fct> <int> ## 1 Adelie male 3750 ## 2 Adelie female 3800 ## 3 Adelie female 3250 ## 4 Adelie <NA> NA ## 5 Adelie female 3450 ## 6 Adelie male 3650 ## 7 Adelie female 3625 ## 8 Adelie male 4675 ## 9 Adelie <NA> 3475 ## 10 Adelie <NA> 4250 ## # … with 334 more rows ``` ] .pull-right[ ```r penguins %>% select(species, sex, body_mass_g) ## # A tibble: 344 x 3 ## species sex body_mass_g ## <fct> <fct> <int> ## 1 Adelie male 3750 ## 2 Adelie female 3800 ## 3 Adelie female 3250 ## 4 Adelie <NA> NA ## 5 Adelie female 3450 ## 6 Adelie male 3650 ## 7 Adelie female 3625 ## 8 Adelie male 4675 ## 9 Adelie <NA> 3475 ## 10 Adelie <NA> 4250 ## # … with 334 more rows ``` ] ] .panel[.panel-name[Arrange] We can use `arrange()` to arrange our data in descending order by **body_mass_g** .pull-left[ ```r glimpse(penguins) ## Rows: 344 ## Columns: 8 ## $ species <fct> Adelie, Adelie, Adelie, Adelie, Adelie, Adelie, Adelie, Adelie, Adelie, Adelie, Adelie, Adelie, Adelie, Adelie, Adelie, Adelie, Adelie… ## $ island <fct> Torgersen, Torgersen, Torgersen, Torgersen, Torgersen, Torgersen, Torgersen, Torgersen, Torgersen, Torgersen, Torgersen, Torgersen, To… ## $ bill_length_mm <dbl> 39.1, 39.5, 40.3, NA, 36.7, 39.3, 38.9, 39.2, 34.1, 42.0, 37.8, 37.8, 41.1, 38.6, 34.6, 36.6, 38.7, 42.5, 34.4, 46.0, 37.8, 37.7, 35.9… ## $ bill_depth_mm <dbl> 18.7, 17.4, 18.0, NA, 19.3, 20.6, 17.8, 19.6, 18.1, 20.2, 17.1, 17.3, 17.6, 21.2, 21.1, 17.8, 19.0, 20.7, 18.4, 21.5, 18.3, 18.7, 19.2… ## $ flipper_length_mm <int> 181, 186, 195, NA, 193, 190, 181, 195, 193, 190, 186, 180, 182, 191, 198, 185, 195, 197, 184, 194, 174, 180, 189, 185, 180, 187, 183, … ## $ body_mass_g <int> 3750, 3800, 3250, NA, 3450, 3650, 3625, 4675, 3475, 4250, 3300, 3700, 3200, 3800, 4400, 3700, 3450, 4500, 3325, 4200, 3400, 3600, 3800… ## $ sex <fct> male, female, female, NA, female, male, female, male, NA, NA, NA, NA, female, male, male, female, female, male, female, male, female, … ## $ year <int> 2007, 2007, 2007, 2007, 2007, 2007, 2007, 2007, 2007, 2007, 2007, 2007, 2007, 2007, 2007, 2007, 2007, 2007, 2007, 2007, 2007, 2007, 20… ``` ] .pull-right[ ```r penguins %>% select(species, sex, body_mass_g) %>% * arrange(desc(body_mass_g)) ## # A tibble: 344 x 3 ## species sex body_mass_g ## <fct> <fct> <int> ## 1 Gentoo male 6300 ## 2 Gentoo male 6050 ## 3 Gentoo male 6000 ## 4 Gentoo male 6000 ## 5 Gentoo male 5950 ## 6 Gentoo male 5950 ## 7 Gentoo male 5850 ## 8 Gentoo male 5850 ## 9 Gentoo male 5850 ## 10 Gentoo male 5800 ## # … with 334 more rows ``` ] ] .panel[.panel-name[Group By & Summarize] .pull-left[ .middle[We can use `group_by()` to group our data by **species** and **sex**, and `summarize()` to calculate the average **body_mass_g** for each grouping.] ] .pull-right[ ```r penguins %>% select(species, sex, body_mass_g) %>% * group_by(species, sex) %>% * summarize(mean = mean(body_mass_g)) ## # A tibble: 8 x 3 ## # Groups: species [3] ## species sex mean ## <fct> <fct> <dbl> ## 1 Adelie female 3369. ## 2 Adelie male 4043. ## 3 Adelie <NA> NA ## 4 Chinstrap female 3527. ## 5 Chinstrap male 3939. ## 6 Gentoo female 4680. ## 7 Gentoo male 5485. ## 8 Gentoo <NA> NA ``` ] ] .panel[.panel-name[Counting 1] If we're just interested in _counting_ the observations in each grouping, we can group and summarize with special functions `count()` and `add_count()`. ---- .pull-left[ Counting can be done with `group_by()` and `summarize()`, but it's a little cumbersome. It involves... 1. using `mutate()` to create an intermediate variable **n_species** that adds up all observations per **species**, and 2. an `ungroup()`-ing step ] .pull-right[ ```r penguins %>% group_by(species) %>% * mutate(n_species = n()) %>% * ungroup() %>% group_by(species, sex, n_species) %>% summarize(n = n()) ## # A tibble: 8 x 4 ## # Groups: species, sex [8] ## species sex n_species n ## <fct> <fct> <int> <int> ## 1 Adelie female 152 73 ## 2 Adelie male 152 73 ## 3 Adelie <NA> 152 6 ## 4 Chinstrap female 68 34 ## 5 Chinstrap male 68 34 ## 6 Gentoo female 124 58 ## 7 Gentoo male 124 61 ## 8 Gentoo <NA> 124 5 ``` ] ] .panel[.panel-name[Counting 2] If we're just interested in _counting_ the observations in each grouping, we can group and summarize with special functions `count()` and `add_count()`. ---- .pull-left[ In contrast, `count()` and `add_count()` offer a simplified approach .small-text[Example kindly [contributed by Alison Hill (@apreshill)](https://github.com/spcanelon/2020-rladies-chi-tidyverse/issues/2)] ] .pull-right[ ```r penguins %>% count(species, sex) %>% * add_count(species, wt = n, * name = "n_species") ## # A tibble: 8 x 4 ## species sex n n_species ## <fct> <fct> <int> <int> ## 1 Adelie female 73 152 ## 2 Adelie male 73 152 ## 3 Adelie <NA> 6 152 ## 4 Chinstrap female 34 68 ## 5 Chinstrap male 34 68 ## 6 Gentoo female 58 124 ## 7 Gentoo male 61 124 ## 8 Gentoo <NA> 5 124 ``` ] ] .panel[.panel-name[Mutate] .pull-left[ We can add to our counting example by using `mutate()` to create a new variable **prop**, which represents the proportion of penguins of each **sex**, grouped by **species** .small-text[Example kindly [contributed by Alison Hill (@apreshill)](https://github.com/spcanelon/2020-rladies-chi-tidyverse/issues/2)] ] .pull-right[ ```r penguins %>% count(species, sex) %>% add_count(species, wt = n, name = "n_species") %>% * mutate(prop = n/n_species*100) ## # A tibble: 8 x 5 ## species sex n n_species prop ## <fct> <fct> <int> <int> <dbl> ## 1 Adelie female 73 152 48.0 ## 2 Adelie male 73 152 48.0 ## 3 Adelie <NA> 6 152 3.95 ## 4 Chinstrap female 34 68 50 ## 5 Chinstrap male 34 68 50 ## 6 Gentoo female 58 124 46.8 ## 7 Gentoo male 61 124 49.2 ## 8 Gentoo <NA> 5 124 4.03 ``` ] ] .panel[.panel-name[Filter] .pull-left[ Finally, we can filter rows to only show us **Chinstrap** penguin summaries by adding `filter()` to our pipeline] .pull-right[ ```r penguins %>% count(species, sex) %>% add_count(species, wt = n, name = "n_species") %>% mutate(prop = n/n_species*100) %>% * filter(species == "Chinstrap") ## # A tibble: 2 x 5 ## species sex n n_species prop ## <fct> <fct> <int> <int> <dbl> ## 1 Chinstrap female 34 68 50 ## 2 Chinstrap male 34 68 50 ``` ] ] ] --- class: penguin-tour <img src="images/pptx/05-forcats.png" width="1200" /> .footnote[<span>Photo by <a href="https://unsplash.com/@eadesstudio?utm_source=unsplash&utm_medium=referral&utm_content=creditCopyText">James Eades</a> on <a href="https://unsplash.com/collections/12240655/palmerpenguins/d5aed8c855e26061e5e651d3f180b76d?utm_source=unsplash&utm_medium=referral&utm_content=creditCopyText">Unsplash</a></span> ] --- background-image: url(images/hex/forcats.png) background-position: 1050px 50px background-size: 80px # forcats: info .panelset[ .panel[.panel-name[Overview] ### Helps us work with **categorical variables** or factors. ### These are variables that have a fixed and known set of possible values, like **species**, **island**, and **sex** in our `penguins` dataset. ] .panel[.panel-name[Cheatsheet] <i class="fas fa-file-pdf "></i> PDF: https://github.com/rstudio/cheatsheets/raw/master/factors.pdf  ] .panel[.panel-name[Reading] .left-column[ <img src="images/r4ds-cover.png" width="222" /> ] .right-column[ ### R for Data Science: [Ch 15 Factors](https://r4ds.had.co.nz/factors.html) ### Package documentation: https://forcats.tidyverse.org/ ] ] ] --- background-image: url(images/hex/forcats.png) background-position: 1050px 50px background-size: 80px # forcats: exercise .panelset[ .panel[.panel-name[Code] .pull-left[ ### Currently the **year** variable in `penguins` is continuous from 2007 to 2009. ### There may be situations where this isn't what we want and we might want to turn it into a categorical variable instead. ] .pull-right[ ### The `factor()` function is perfect for this. ```r penguins %>% mutate(year_factor = * factor(year, * levels = unique(year))) ``` ] ] .panel[.panel-name[Result] ### The result is a new factor **year_factor** with levels **2007**, **2008**, and **2009** .pull-left[ ```r penguins_new <- penguins %>% mutate(year_factor = * factor(year, * levels = unique(year))) penguins_new ## # A tibble: 344 x 9 ## species island bill_length_mm bill_depth_mm flipper_length_mm body_mass_g sex year year_factor ## <fct> <fct> <dbl> <dbl> <int> <int> <fct> <int> <fct> ## 1 Adelie Torgersen 39.1 18.7 181 3750 male 2007 2007 ## 2 Adelie Torgersen 39.5 17.4 186 3800 female 2007 2007 ## 3 Adelie Torgersen 40.3 18 195 3250 female 2007 2007 ## 4 Adelie Torgersen NA NA NA NA <NA> 2007 2007 ## 5 Adelie Torgersen 36.7 19.3 193 3450 female 2007 2007 ## 6 Adelie Torgersen 39.3 20.6 190 3650 male 2007 2007 ## 7 Adelie Torgersen 38.9 17.8 181 3625 female 2007 2007 ## 8 Adelie Torgersen 39.2 19.6 195 4675 male 2007 2007 ## 9 Adelie Torgersen 34.1 18.1 193 3475 <NA> 2007 2007 ## 10 Adelie Torgersen 42 20.2 190 4250 <NA> 2007 2007 ## # … with 334 more rows ``` ] .pull-right[ ```r class(penguins_new$year_factor) ## [1] "factor" levels(penguins_new$year_factor) ## [1] "2007" "2008" "2009" ``` ] ] ] --- class: penguin-tour <img src="images/pptx/06-stringr.png" width="1200" /> .footnote[<span>Photo by <a href="https://unsplash.com/@eadesstudio?utm_source=unsplash&utm_medium=referral&utm_content=creditCopyText">James Eades</a> on <a href="https://unsplash.com/collections/12240655/palmerpenguins/d5aed8c855e26061e5e651d3f180b76d?utm_source=unsplash&utm_medium=referral&utm_content=creditCopyText">Unsplash</a></span> ] --- background-image: url(images/hex/stringr.png) background-position: 1050px 50px background-size: 80px # stringr: info .panelset[ .panel[.panel-name[Overview] .pull-left[ ### `stringr` helps us manipulate strings! The package includes many functions to help us with **regular expressions**, which are a concise language for describing patterns in strings. ] .pull-right[ ### These functions help us - detect matches - subset strings - manage string lengths - mutate strings - join and split strings - order strings - ...and more! ] ] .panel[.panel-name[Cheatsheet] <i class="fas fa-file-pdf "></i> PDF: https://github.com/rstudio/cheatsheets/raw/master/strings.pdf  ] .panel[.panel-name[Reading] .left-column[ <img src="images/r4ds-cover.png" width="222" /> ] .right-column[ ### R for Data Science: [Ch 14 Strings](https://r4ds.had.co.nz/strings.html) ### Package documentation: https://stringr.tidyverse.org/ ] ] ] --- background-image: url(images/hex/stringr.png) background-position: 1050px 50px background-size: 80px # stringr: exercise .panelset[ .panel[.panel-name[Mutate] ### What does this chunk do? ```r penguins %>% select(species, island) %>% * mutate(ISLAND = str_to_upper(island)) ## # A tibble: 344 x 3 ## species island ISLAND ## <fct> <fct> <chr> ## 1 Adelie Torgersen TORGERSEN ## 2 Adelie Torgersen TORGERSEN ## 3 Adelie Torgersen TORGERSEN ## 4 Adelie Torgersen TORGERSEN ## 5 Adelie Torgersen TORGERSEN ## 6 Adelie Torgersen TORGERSEN ## 7 Adelie Torgersen TORGERSEN ## 8 Adelie Torgersen TORGERSEN ## 9 Adelie Torgersen TORGERSEN ## 10 Adelie Torgersen TORGERSEN ## # … with 334 more rows ``` ] .panel[.panel-name[Join] ### How about this one? ```r penguins %>% select(species, island) %>% mutate(ISLAND = str_to_upper(island)) %>% * mutate(species_island = str_c(species, ISLAND, sep = "_")) ## # A tibble: 344 x 4 ## species island ISLAND species_island ## <fct> <fct> <chr> <chr> ## 1 Adelie Torgersen TORGERSEN Adelie_TORGERSEN ## 2 Adelie Torgersen TORGERSEN Adelie_TORGERSEN ## 3 Adelie Torgersen TORGERSEN Adelie_TORGERSEN ## 4 Adelie Torgersen TORGERSEN Adelie_TORGERSEN ## 5 Adelie Torgersen TORGERSEN Adelie_TORGERSEN ## 6 Adelie Torgersen TORGERSEN Adelie_TORGERSEN ## 7 Adelie Torgersen TORGERSEN Adelie_TORGERSEN ## 8 Adelie Torgersen TORGERSEN Adelie_TORGERSEN ## 9 Adelie Torgersen TORGERSEN Adelie_TORGERSEN ## 10 Adelie Torgersen TORGERSEN Adelie_TORGERSEN ## # … with 334 more rows ``` ] ] --- class: penguin-tour <img src="images/pptx/07-tidyr.png" width="1200" /> .footnote[<span>Photo by <a href="https://unsplash.com/@eadesstudio?utm_source=unsplash&utm_medium=referral&utm_content=creditCopyText">James Eades</a> on <a href="https://unsplash.com/collections/12240655/palmerpenguins/d5aed8c855e26061e5e651d3f180b76d?utm_source=unsplash&utm_medium=referral&utm_content=creditCopyText">Unsplash</a></span> ] --- background-image: url(images/hex/tidyr.png) background-position: 1050px 50px background-size: 80px # tidyr: info .panelset[ .panel[.panel-name[Overview] [From R for Data Science](https://r4ds.had.co.nz/tidy-data.html): > There are three interrelated rules which make a dataset tidy: > - Each variable must have its own column. > - Each observation must have its own row. > - Each value must have its own cell.  ] .panel[.panel-name[Cheatsheet] <i class="fas fa-file-pdf "></i> PDF: https://github.com/rstudio/cheatsheets/raw/master/data-import.pdf  ] .panel[.panel-name[Reading] .left-column[ <img src="images/r4ds-cover.png" width="222" /> ] .right-column[ ### R for Data Science: [Ch 12 Tidy data](https://r4ds.had.co.nz/tidy-data.html) ### Package documentation: https://tidyr.tidyverse.org/ ] ] ] --- background-image: url(images/hex/tidyr.png) background-position: 1050px 50px background-size: 80px # tidyr: exercise .panelset[ .panel[.panel-name[Un-tidying] ### Both penguin datasets are already tidy! We can pretend that `penguins` wasn't tidy and that it looked instead like `untidy_penguins` below, where **body_mass_g** was recorded separately for *male*, *female*, and *NA* **sex** penguins. ```r untidy_penguins <- penguins %>% pivot_wider(names_from = sex, values_from = body_mass_g) untidy_penguins ## # A tibble: 344 x 9 ## species island bill_length_mm bill_depth_mm flipper_length_mm year male female `NA` ## <fct> <fct> <dbl> <dbl> <int> <int> <int> <int> <int> ## 1 Adelie Torgersen 39.1 18.7 181 2007 3750 NA NA ## 2 Adelie Torgersen 39.5 17.4 186 2007 NA 3800 NA ## 3 Adelie Torgersen 40.3 18 195 2007 NA 3250 NA ## 4 Adelie Torgersen NA NA NA 2007 NA NA NA ## 5 Adelie Torgersen 36.7 19.3 193 2007 NA 3450 NA ## 6 Adelie Torgersen 39.3 20.6 190 2007 3650 NA NA ## 7 Adelie Torgersen 38.9 17.8 181 2007 NA 3625 NA ## 8 Adelie Torgersen 39.2 19.6 195 2007 4675 NA NA ## 9 Adelie Torgersen 34.1 18.1 193 2007 NA NA 3475 ## 10 Adelie Torgersen 42 20.2 190 2007 NA NA 4250 ## # … with 334 more rows ``` ] .panel[.panel-name[Re-tidying] ### Now let's make it tidy again! We'll use the help of `pivot_longer()` ```r untidy_penguins %>% * pivot_longer(cols = male:`NA`, * names_to = "sex", * values_to = "body_mass_g") ## # A tibble: 1,032 x 8 ## species island bill_length_mm bill_depth_mm flipper_length_mm year sex body_mass_g ## <fct> <fct> <dbl> <dbl> <int> <int> <chr> <int> ## 1 Adelie Torgersen 39.1 18.7 181 2007 male 3750 ## 2 Adelie Torgersen 39.1 18.7 181 2007 female NA ## 3 Adelie Torgersen 39.1 18.7 181 2007 NA NA ## 4 Adelie Torgersen 39.5 17.4 186 2007 male NA ## 5 Adelie Torgersen 39.5 17.4 186 2007 female 3800 ## 6 Adelie Torgersen 39.5 17.4 186 2007 NA NA ## 7 Adelie Torgersen 40.3 18 195 2007 male NA ## 8 Adelie Torgersen 40.3 18 195 2007 female 3250 ## 9 Adelie Torgersen 40.3 18 195 2007 NA NA ## 10 Adelie Torgersen NA NA NA 2007 male NA ## # … with 1,022 more rows ``` ] ] --- class: penguin-tour <img src="images/pptx/08-purrr.png" width="1200" /> .footnote[<span>Photo by <a href="https://unsplash.com/@eadesstudio?utm_source=unsplash&utm_medium=referral&utm_content=creditCopyText">James Eades</a> on <a href="https://unsplash.com/collections/12240655/palmerpenguins/d5aed8c855e26061e5e651d3f180b76d?utm_source=unsplash&utm_medium=referral&utm_content=creditCopyText">Unsplash</a></span> ] --- background-image: url(images/hex/purrr.png) background-position: 1050px 50px background-size: 80px # purrr: info .panelset[ .panel[.panel-name[Overview] .pull-left[ ### Provides tools for working with functions and vectors ### The `purrr` family of functions helps us replace for loops, making our code easier to read and more succint. ] .pull-right[ ### With `purrr` you can - Iterate over a single input with `map()` - Iterate over two inputs in parallel with `map2()` - Iterate with multiple arguments with `pmap()` - Iterate with multiple arguments and functions with `invoke_map()` - Call a function for its side-effects with `walk()`, `walk2()`, and `pwalk()` ] ] .panel[.panel-name[Cheatsheet] <i class="fas fa-file-pdf "></i> PDF: https://github.com/rstudio/cheatsheets/raw/master/purrr.pdf  ] .panel[.panel-name[Reading] .left-column[ <img src="images/r4ds-cover.png" width="222" /> ] .right-column[ ### R for Data Science: [Ch 21 Iteration](https://r4ds.had.co.nz/iteration.html) ### Package documentation: https://purrr.tidyverse.org/ ] ] ] --- background-image: url(images/hex/purrr.png) background-position: 1050px 50px background-size: 80px # purrr: exercise .panelset[ .panel[.panel-name[Time for a change?] .pull-left[ ### Ok, we love our earlier boxplot showing us **body_mass_g** by **sex** and colored by **species**... but let's change up the colors to keep with our Antarctica theme! ### I'm a big fan of the color palettes in the `nord` 📦 ] .pull-right[  ] ] .panel[.panel-name[Goal] .pull-left[ ### Let's turn this plot <img src="2020-rladies-chi-tidyverse_files/figure-html/unnamed-chunk-50-1.png" width="504" /> ] .pull-right[ ### Into this one! <img src="2020-rladies-chi-tidyverse_files/figure-html/unnamed-chunk-51-1.png" width="504" /> .panel[.panel-name[Option 1] .pull-left[ ```r library(nord) # you can choose colors using # the color hex codes nord::nord_palettes$frost ## [1] "#8FBCBB" "#88C0D0" "#81A1C1" "#5E81AC" ``` ```r # and assign them using the # `scale_fill_manual()` function penguins %>% ggplot(aes(x = sex, y = body_mass_g)) + geom_boxplot(aes(fill = species)) + * scale_fill_manual(values = c("#8FBCBB", "#88C0D0", "#81A1C1")) ``` ] .pull-right[ <img src="2020-rladies-chi-tidyverse_files/figure-html/unnamed-chunk-54-1.png" width="504" /> ] ] .panel[.panel-name[Options 2 & 3] .pull-left[ ...but you might prefer to use the palette name! <br/> ```r penguins %>% ggplot(aes(x = sex, y = body_mass_g)) + geom_boxplot(aes(fill = species)) + * scale_fill_manual(values = nord::nord_palettes$frost) ``` <img src="2020-rladies-chi-tidyverse_files/figure-html/unnamed-chunk-55-1.png" width="360" /> ] .pull-right[ And some color palette packages also come with their own functions like `scale_fill_nord()` ```r penguins %>% ggplot(aes(x = sex, y = body_mass_g)) + geom_boxplot(aes(fill = species)) + * nord::scale_fill_nord(palette = "frost") ``` <img src="2020-rladies-chi-tidyverse_files/figure-html/unnamed-chunk-56-1.png" width="360" /> ] ] .panel[.panel-name[Purrr?] .pull-left[ The `prismatic` 📦 helps us **see** the colors that correspond to each color hex code (mostly), with the `color()` function ```r library(prismatic) ``` ```r prismatic::color(nord::nord_palettes$frost) ```  ] .pull-right[ `purrr`'s `map()` function can help us iterate `color()` over all palettes in a palette package like `nord`! ```r nord::nord_palettes %>% map(prismatic::color) ```  ] ] ] ] .panel[.panel-name[More palettes!] .pull-left[ ### 🎨 [r-color-palettes repo](https://github.com/EmilHvitfeldt/r-color-palettes) from Emil Hvitfeldt ### Like this Wes Anderson themed one! And many, many others. 🤩 ] .pull-right[ 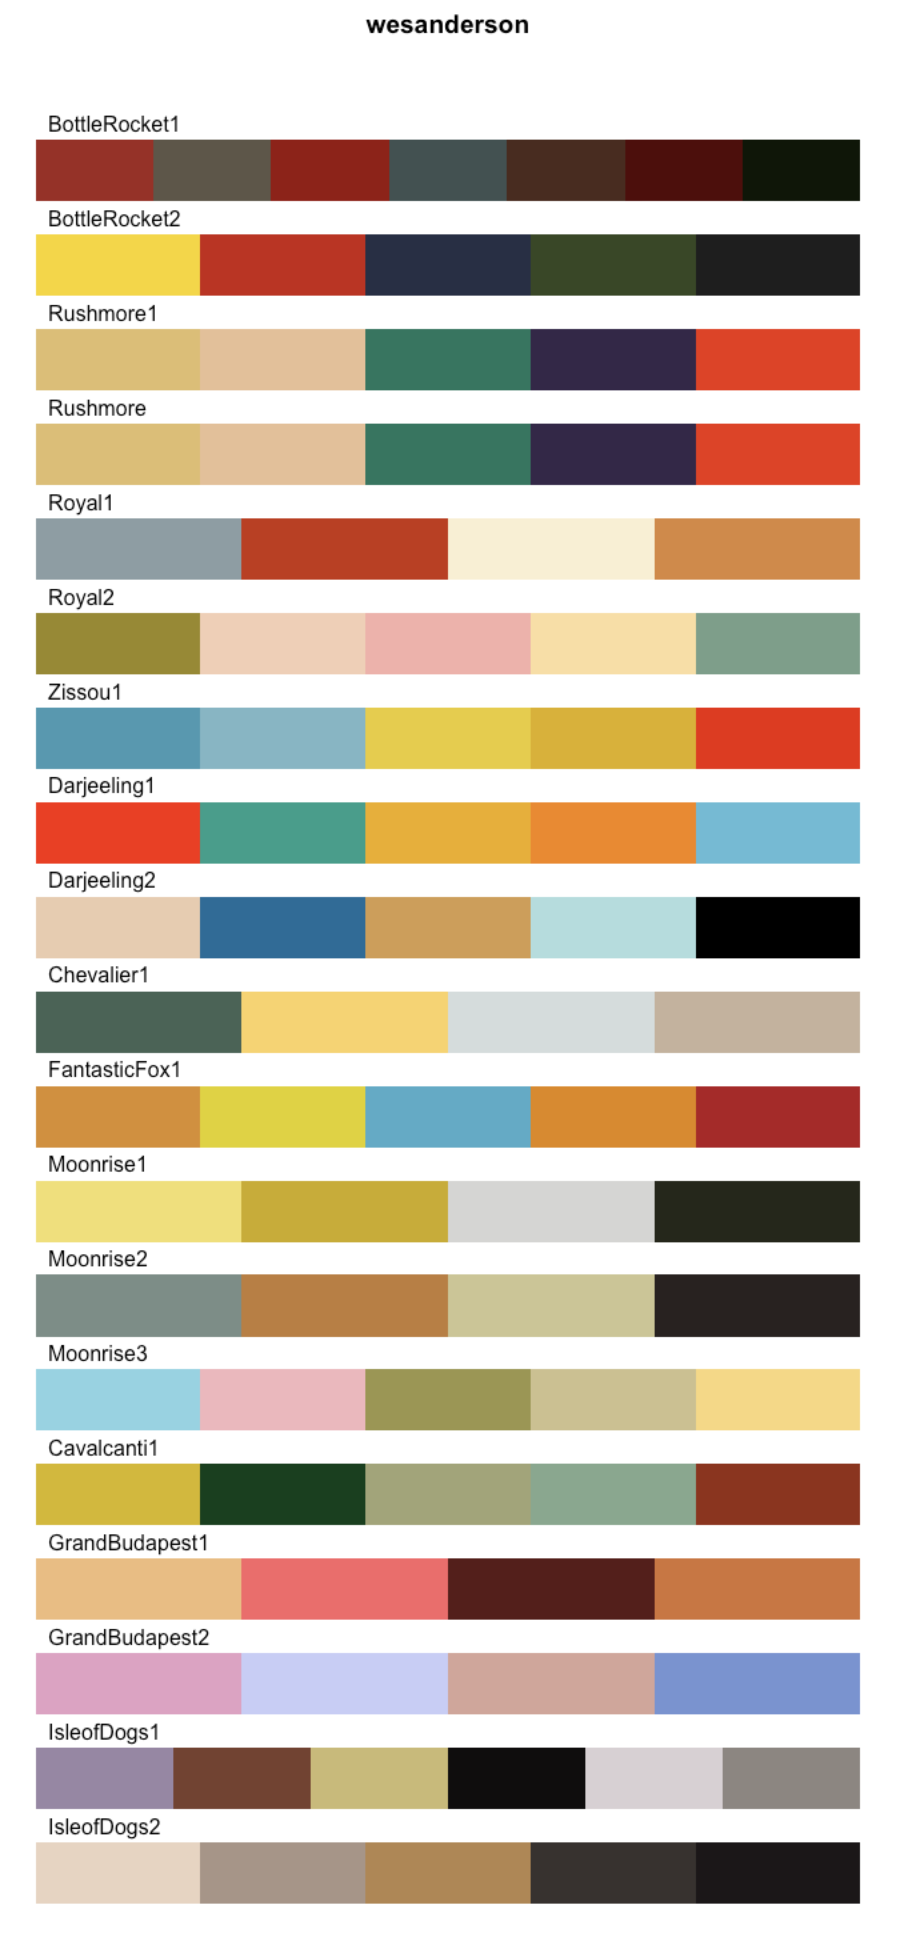 ] ] ] --- class: about-me, middle, center # Thank you! ## Any questions?